
When working in environments where high volumes have to be processed and response times or process duration are a concern, this is important to have statistics on BusinessWorks process execution to be able to find the bottlenecks and resolve them.
Active processes view
As in BusinessWorks 5.X it is possible to view the list of processes that are currently running.
This is available in the ‘Process Details’ view of the ‘Process’ tab of the ‘Application’ panel when in default mode.
On that view you can choose to see all processes of the application or one specific process.

In the example above you can see that there are five process instances currently running, when they started and since how long they are active.
Process statistics
Process instrumentation should be enabled.

Note that there is an overhead from the Statistics Collection but this is very limited.
Once done you can view general statistics on a process execution, after selecting the process in the ‘Process view’ of the ‘Process’ tab of the ‘Application’ panel when in ‘Monitor’ mode.

The Elapse Time is the total time taken by the execution of a given for a process this include wait for replies in asynchronous activities like Service Invocation or JMS Request / Reply.
The Execution Time is the time taken by activity execution within BusinessWorks. When Execution Time is lower than the Elapse Time the difference between Elapse Time and Execution Time (‘Elapse Time’ — ‘Execution Time’) is a wait time. This generally covers time spent in waiting for replies in asynchronous activities or waiting for the process execution to be scheduled in the BusinessWorks engine.
In the example above you can see that the process Loader has been created 510 times and completed 509 times since the BusinessWorks engine started (which means that one instance is running).
You can see also that average Elapsed Time is 544 ms, max Elapsed Time is 600 ms and min Elapsed Time is 529 ms, also the average Execution Time is 7 ms, max Execution Time is 20 ms and min Execution Time is 0 ms.
Activity statistics
Statistics on activities are available in the ‘Activity view’ of the previous panel (‘ Activity view’ of the ‘Process’ tab of the ‘Application’ panel when in ‘Monitor’ mode).
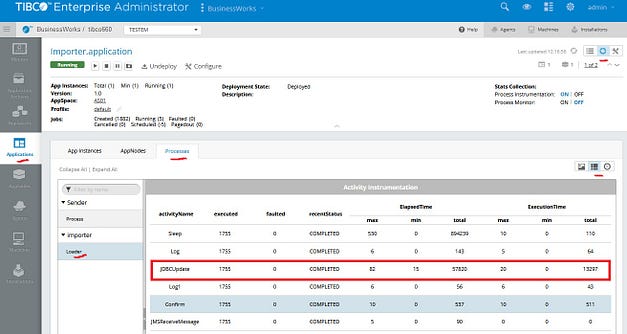
As in the Process statistics view the Elapse Time is the total time taken by the execution of an activity including the time spent waiting for replies in asynchronous activities like Service Invocation or JMS Request / Reply and the Execution Time is the time taken by an activity execution within BusinessWorks. When Execution Time is lower than the Elapse Time the difference between Elapse Time and Execution Time (‘Elapse Time’ — ‘Execution Time’) is the time spent in waiting for replies in asynchronous activities.
Note that Elapse Time and Execution Time of a given activity include the time to evaluate the conditions of the transitions starting from the activity.
In the example above you can see that the JDBC Update activity as executed 1755 times, you can also see that max Elapsed Time is 82 ms and min Elapsed Time is 15 ms, also the max Execution Time is 20 ms and min Execution Time is 0 ms.
From the total Elapsed Time 57820 ms we can calculated an average Elapsed Time of 33 ms.
The max execution time is 20 ms and min execution time is 0 ms.
From the total Elapsed Time 13297 ms we can calculated an average Elapsed Time of 7.5 ms.
Overall we can conclude that in average executing the target SQL statement takes 25,5 ms.
Summary
Using the Active Processes view you can quickly see how many processes are active at a given point in time.
Using the Process and Activity statistics, that are available after enabling the Statistics Collection, you can get the total execution time for application processes and activities (with average, minimum and maximum values) and the related processing time (again average, minimum and maximum values).
These elements will help you find the bottlenecks in your processes and identify areas that needs to be improved in the application code or runtime configuration to reach your performances or response times target.
Reference elements
Exact definitions of ‘Elapsed Time’ and ‘Execution Time’ for Processes and Activities are available in the following BusinessWorks documentation pages :
Recommended Comments
There are no comments to display.
Create an account or sign in to comment
You need to be a member in order to leave a comment
Create an account
Sign up for a new account in our community. It's easy!
Register a new accountSign in
Already have an account? Sign in here.
Sign In Now