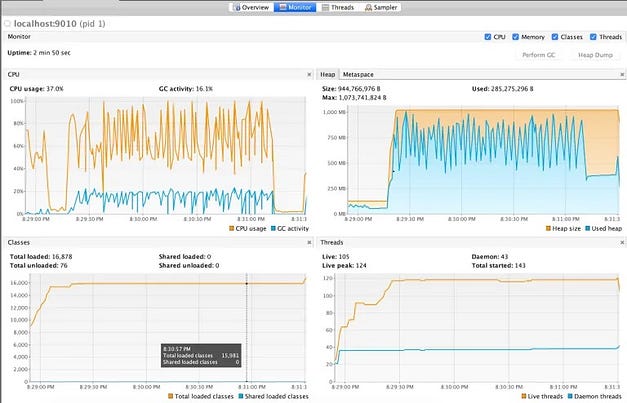
Limiting memory usage is sometimes a challenge in BusinessWorks environments because volumes to process depends from the business activity (number of orders to process per second, number of items in an order, …).
In BusinessWorks memory usage mostly depends from the number of events processed in parallel in the BusinessWorks engine, the size of the data blocks to process and how the engine is internally managing memory block allocations.
Also depending on the use case some Java Virtual Machine configuration options can be used for the JVM to return unused heap space to the operation system.

This means there are basically five ways to reduce memory usage in BusinessWorks.
Limiting the number of events processed in parallel
This is possible by using the Flow Control mechanisms available in BusinessWorks (for example the Flow Limit mechanism) and also the specific mechanisms available in the transport protocols commonly used in BusinessWorks (For example the Client Acknowledgement + Max Sessions mechanism available with JMS).
For BusinessWorks 6.X and BusinessWorks Container Edition this is covered in the following article :
For BusinessWorks 5.X this is covered in the following article :
Processing large data blocks in small chunks
In some scenarios there could be large data blocks to process, for example received files can be very large or database queries can return a very high number of lines.
The correct approach to manage such cases is to use mechanisms available in BusinessWorks to process data blocks in small chunks :
· The ‘Parse Data’ activity can be configured with ‘File’ input type, ‘no of Records’ and a ‘Start Record’ number and used in an Iteration Loop configured to exit when the ‘End of File’ condition is met
This is explained in the following article:
· The ‘JDBC Query’ activity can be configured with the ‘Process in sub set’ option and ‘JDBC Update’ activity can be configured with the ‘Batch update’ option
This is explained in the following article:
· Also XML documents can be processed in small chunks with the LargeXML Plugin
Using the memory saving mode of BusinessWorks
When processing large data blocks this is also generally useful to use the memory saving mode. When it is enabled the BusinessWorks engine releases the memory blocks used to manage the activity outputs as soon as possible allowing the Java Garbage Collector to reuse the corresponding memory space.
For BusinessWorks 6.X and BusinessWorks Container Edition this is covered in the following article :
Deploying multiple applications in the same appspace
One solution to reduce memory usage that is specific to BusinessWorks 6.X is to deploy multiple applications per appspace.
This is common to deploy up to 10 to 15 applications in the same appspace.
Configuring the JVM to return memory to the operating system
In Java 11, used by BusinessWorks 6.8.x, 6.9.x and 6.10.x and also BusinessWorks 5.15.x, the default Garbage Collector is G1GC. An issue with this Garbage Collector in Java 11 is that it is never returning memory to the operating system.
This is a problem for applications that process periodically large volumes of data, like for example processing a large file once per day, while once the Heap Size would have been extended to process the data it will never reduce and the related memory would never be returned to the OS.
The solution to manage this is to use ParallelGC instead of G1GC (that is the default Garbage Collector in Java 11). This Garbage Collector can be enabled by editing the tra files of the target appnodes with the following:
java.extended.properties=-Xmx2048m -Xms128m -XX:+UseParallelGC -XX:+HeapDumpOnOutOfMemoryError
It is also possible to make the JVM return unused memory in a more aggressive way than with the default configuration by using the following JVM options (that can be also used with Java 8):
-XX:+UseParallelGC -XX:MinHeapFreeRatio=20 -XX:MaxHeapFreeRatio=35 -XX:GCTimeRatio=4 -XX:AdaptiveSizePolicyWeight=90
This is to be set in the tra files of the target appnodes, for example:
java.extended.properties=-Xmx2048m -Xms128m -XX:UseParallelGC -XX:MinHeapFreeRatio=20 -XX:MaxHeapFreeRatio=35 -XX:GCTimeRatio=4 -XX:AdaptiveSizePolicyWeight=90 -XX:+HeapDumpOnOutOfMemoryError
With the options above:
. The heap grows when there is less than 20 % free space (MinHeapFreeRatio=20) (note that the default value is 40)
. The heap shrinks when there is more than 35 % free space (MaxHeapFreeRatio=35) (note that the default value is 70)
. The JVM can use up to 20 % of the cpu time to do Garbage Collection (GCTimeRatio=4)
Important things to know :
. These values can be adjusted for the JVM to return memory in a more aggressive fashion if needed (for example MinHeapFreeRatio =10 and MaxHeapFreeRatio=20)
. The MinHeapFreeRatio and MaxHeapFreeRatio are supported with G1GC but they generally have no effect with this Garbage Collector while G1GC is avoiding as much as possible to do full Garbage Collections
. Use of these options will increase a bit the cpu usage, they are not to be used when the flow of events to process don’t vary much over time
For more details about those options you can have a look to the following Redhat blog articles :
https://access.redhat.com/documentation/en-us/openshift_container_platform/3.11/html/developer_guide/dev-guide-application-memory-sizing
https://developers.redhat.com/blog/2014/07/15/dude-wheres-my-paas-memory-tuning-javas-footprint-in-openshift-part-1/
https://developers.redhat.com/blog/2014/07/22/dude-wheres-my-paas-memory-tuning-javas-footprint-in-openshift-part-2/
Summary
To limit memory usage in BusinessWorks you have to use the available Flow Control mechanisms and when processing large data blocks process them in small chunks and use the ‘memory saving’ mode.
When processing events once per day or once per hour you can also configure the JVM to return unused heap space to the operating system.


Recommended Comments
There are no comments to display.
Create an account or sign in to comment
You need to be a member in order to leave a comment
Create an account
Sign up for a new account in our community. It's easy!
Register a new accountSign in
Already have an account? Sign in here.
Sign In Now